Cryptocurrencies are known for their volatility, a trait that can be both thrilling and daunting for traders. To navigate these turbulent waters, many turn to technical analysis—a strategy that relies on historical price data and market trends to make informed trading decisions. In the fast-paced world of crypto, understanding technical analysis is not just helpful; it’s essential.
What is Technical Analysis?
At its core, technical analysis is the study of past market data, primarily price and volume, to forecast future price movements. Unlike fundamental analysis, which looks at the intrinsic value of an asset, technical analysis focuses on patterns, trends, and statistical indicators that emerge from market activity. By examining charts and using various tools, traders can identify potential entry and exit points, gauge market sentiment, and manage risk more effectively.
Why Technical Analysis Matters More in the Crypto World
Cryptocurrencies are a unique asset class. Unlike traditional markets that have decades of historical data, crypto is relatively new, with less data to draw upon. This makes it more challenging to apply fundamental analysis because there’s often no earnings report, balance sheet, or long-term historical context. This is where technical analysis becomes invaluable.
Crypto markets operate 24/7, with high liquidity and low barriers to entry. These characteristics lead to frequent price swings, often driven by speculation, news events, or even social media hype. In such an environment, being able to quickly interpret market movements through technical analysis can give traders a significant edge. It allows for real-time decision-making, which is crucial when prices can change drastically in a matter of minutes.
Popular and Reliable Methods of Technical Analysis in Crypto
- Support and Resistance Levels:
What They Are: These are key price levels where the asset tends to reverse direction or pause. Support levels are where prices tend to stop falling, and resistance levels are where prices tend to stop rising.
Why They Matter: In crypto trading, where sentiment can shift quickly, identifying these levels helps traders anticipate potential reversals and set stop-loss orders effectively.
- Moving Averages (MA):
What They Are: Moving averages smooth out price data to create a single flowing line that makes it easier to identify the direction of the trend.
Why They Matter: Crypto markets can be erratic. Moving averages help filter out the “noise” and give a clearer picture of the overall trend. Popular choices include the 50-day and 200-day moving averages.
- Candlestick Patterns:
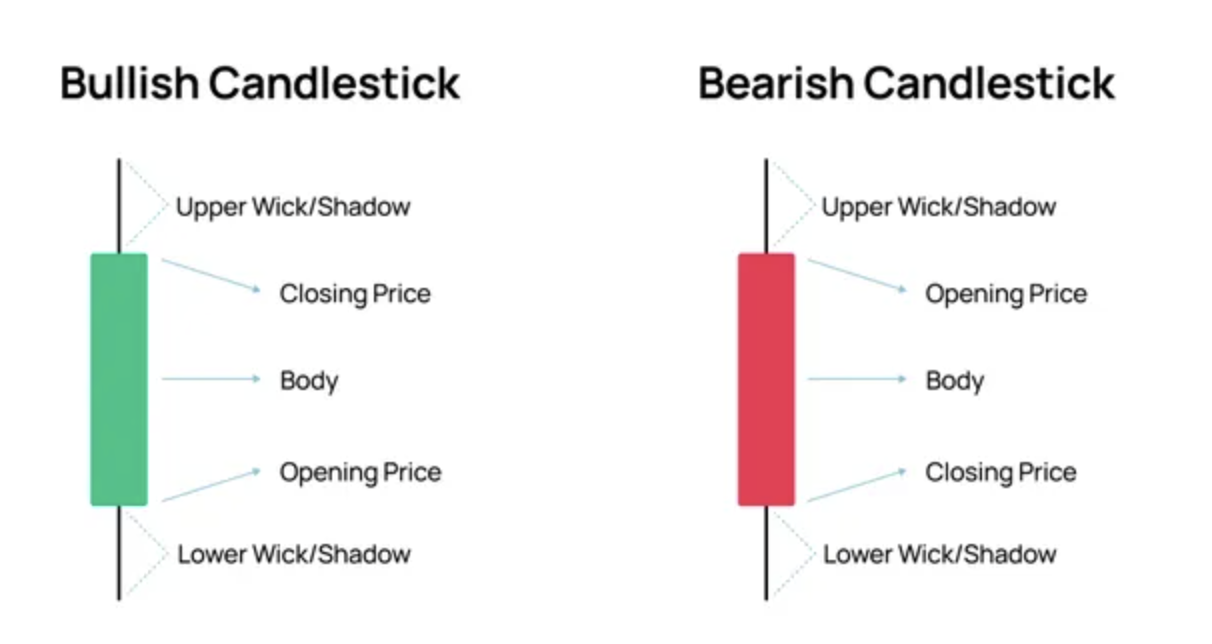
What They Are: Candlestick patterns are specific formations of price movements depicted in candlestick charts. Each “candlestick” shows the open, close, high, and low prices within a given time frame. Some of the most popular candlestick patterns include the Doji, Hammer, Shooting Star, Bullish Engulfing, and Bearish Engulfing patterns. These patterns are widely used by traders to identify potential reversals, continuations, or trends.
Why They Matter: Candlestick patterns provide a visual representation of market psychology, revealing potential reversals or continuations at critical levels. Recognizing these patterns, such as the Hammer indicating a potential bottom or the Engulfing patterns suggesting a shift in momentum, can give traders a significant advantage in timing their trades. There are many more patterns beyond the popular ones mentioned here, each offering unique insights into market behavior.
- Relative Strength Index (RSI):
What It Is: RSI is a momentum oscillator that measures the speed and change of price movements on a scale of 0 to 100. It helps identify overbought or oversold conditions.
Why It Matters: In crypto, where momentum can build up quickly, RSI helps traders identify when a coin might be due for a correction, allowing them to avoid buying at the peak or selling at the bottom.
- Bollinger Bands:
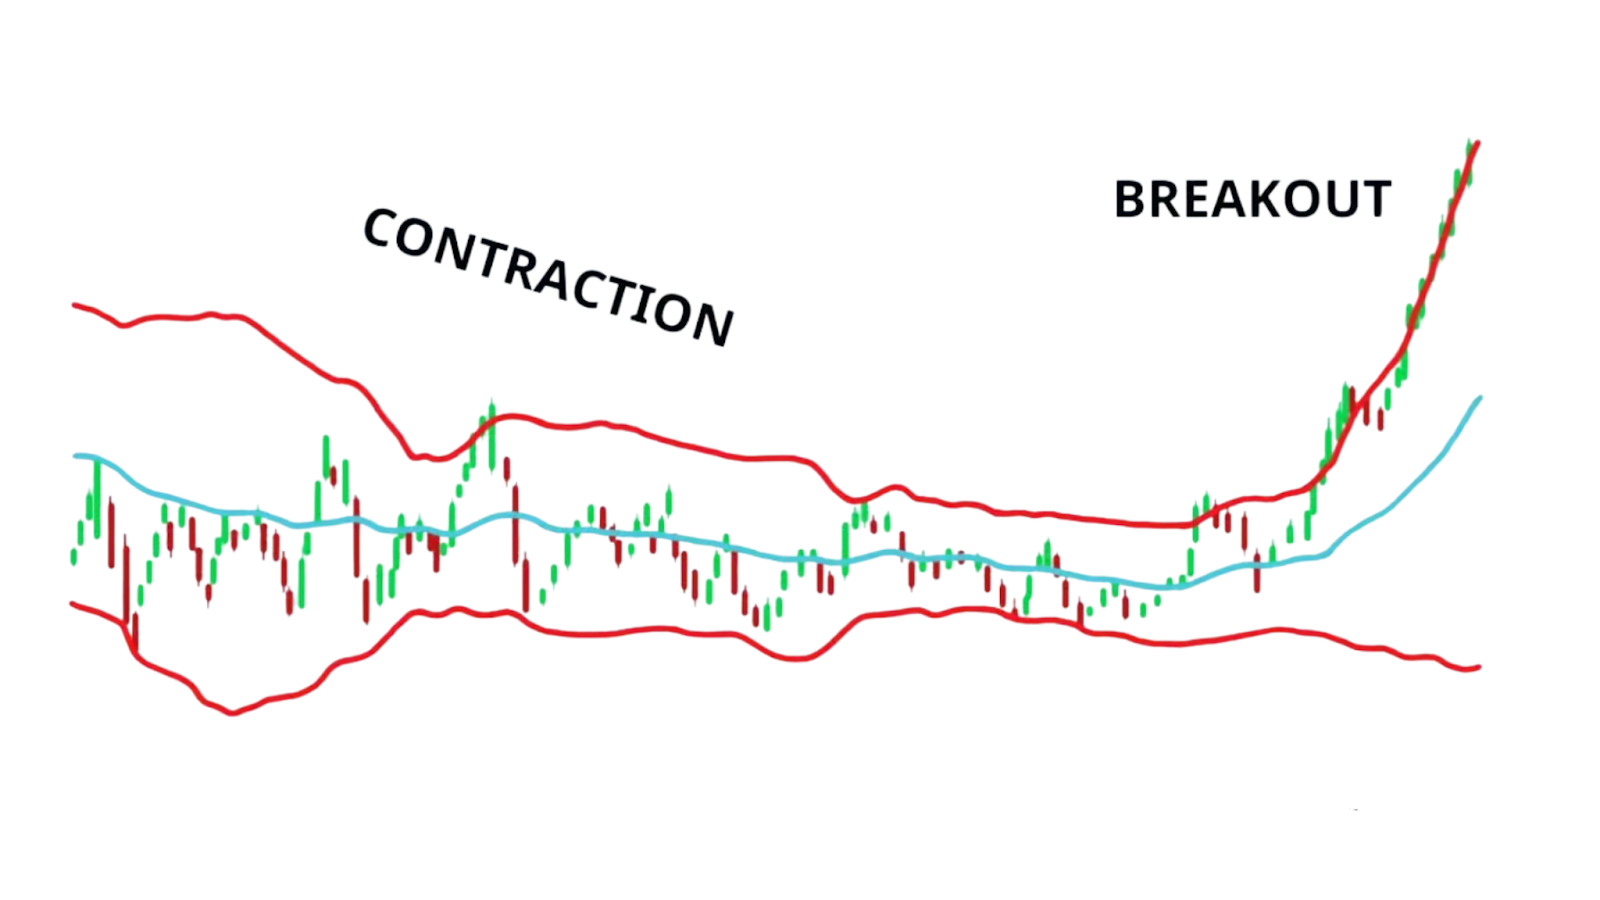
What They Are: Bollinger Bands consist of a middle moving average band and two outer bands, representing volatility. They expand and contract based on market conditions.
Why They Matter: Bollinger Bands are particularly useful in crypto because they can signal periods of high volatility. When the bands tighten, it might indicate a period of consolidation before a breakout, giving traders an early warning.
Common Mistakes in Crypto Technical Analysis and How to Avoid Them
One of the most prevalent pitfalls in crypto trading is overtrading based on short-term indicators. The thrill of seeing rapid price movements often drives traders to make hasty decisions, reacting impulsively to minor fluctuations rather than sticking to a well-thought-out strategy. This can lead to buying and selling at less-than-optimal times, ultimately eroding potential profits. To avoid this, it’s essential to adhere to your trading plan and not let short-term indicators dictate your every move. Instead, focus on longer time frames to gain a clearer perspective on the market’s overall direction.
Another common mistake is ignoring market sentiment. Many traders rely exclusively on technical indicators, overlooking the broader context of market sentiment that can significantly impact price movements. This tunnel vision can create blind spots, where technical patterns suggest one thing, but the market moves in the opposite direction due to prevailing sentiment. To mitigate this risk, it’s crucial to blend technical analysis with an understanding of market sentiment. Keeping an eye on news, trends, and social media chatter can provide valuable insights that complement your technical strategy.
Chasing trends is another trap that many traders fall into. The fear of missing out on a profitable move can lead to jumping on a trend too late, resulting in buying high and selling low—a recipe for losses. To avoid this, focus on identifying early signs of a trend rather than reacting to one that’s already well-established. Indicators like moving averages can help you spot trends in their early stages, allowing you to enter trades with better timing and more favorable risk-reward ratios.
Lastly, neglecting risk management is a mistake that can be costly. Trading without a clear strategy, or failing to set stop-loss orders, leaves you vulnerable to significant losses. Effective risk management is about more than just making profits; it’s about preserving your capital. Before entering any trade, clearly define your risk parameters and use tools like stop-loss orders and position sizing to protect your investments. By doing so, you can ensure that a single bad trade doesn’t wipe out your gains and keep your trading journey on a steady path.
Practical Steps to Begin Learning Technical Analysis
To start your journey in technical analysis, it’s essential to build a strong foundation. Begin by learning how to read candlestick charts, as these are the most widely used in crypto trading. Understand how each candlestick represents price movements within a specific time frame, and get familiar with basic patterns like the Hammer, Doji, and Engulfing. These patterns can indicate potential reversals or continuations in price trends, which are critical for making informed trading decisions.
Once you’re comfortable with reading charts, dive into key technical indicators that will help you interpret market data more effectively. Start with Moving Averages to identify the general direction of the market, and use the Relative Strength Index (RSI) to gauge whether an asset is overbought or oversold. Bollinger Bands can also be particularly useful in crypto for identifying periods of high volatility, signaling potential breakouts or consolidations.
Developing a simple trading strategy is your next step. This doesn’t have to be complex; even a basic plan that incorporates one or two indicators along with clear entry and exit rules can be effective. For example, you might decide to enter a trade when the price crosses above a 50-day moving average and RSI confirms bullish momentum. Before going live, backtest your strategy using historical data to see how it would have performed under different market conditions.
Hands-on practice is crucial, and demo accounts offered by platforms like TradingView or Binance can be incredibly helpful. These allow you to test your strategies in real-time without risking actual capital. Use this opportunity to refine your approach, learn from mistakes, and gain confidence in your trading decisions.
To stay sharp, immerse yourself in the crypto trading community. Join forums, participate in discussions, and follow experienced traders on platforms like Twitter or Discord. This not only keeps you updated on market trends but also exposes you to new strategies and tools that can enhance your technical analysis skills.
Remember, technical analysis is a craft that requires time and consistent effort. Focus on improving incrementally, and don’t be discouraged by setbacks. By regularly practicing and staying engaged with the latest developments in the market, you’ll steadily build your expertise and confidence as a crypto trader.
Conclusion
Technical analysis is not a crystal ball, but in the unpredictable world of crypto, it’s one of the most reliable tools traders have. By mastering techniques like support and resistance levels, moving averages, RSI, and Bollinger Bands, you can make more informed decisions and avoid common pitfalls. Remember, the key to success in crypto trading is not just understanding the charts, but also managing your emotions and maintaining discipline. With the right approach, technical analysis can help you navigate the crypto markets with confidence.