Getting into the crypto industry requires consistent learning and research due to its vast ecosystem. You can sum up the entire sector with the term of volatility that leads to price changes, so investors must always be wary of these fluctuations to adjust their strategies on the go. Whether they invest for the short or the long term, volatility can influence every portfolio’s value in the long run.
Therefore, investors should learn how to read a crypto chart. Luckily, many patterns can be easily identified within the system and are all colored to represent upswings or downside trends better. For example, if you can read the current Bitcoin price chart, you may be able to predict when the cryptocurrency will be taken aback by altcoins and vice versa, so you can expand your investments or continue with Bitcoin.
If you want to know the basics of a crypto chart, here’s a brief introduction that will help you enter the market.
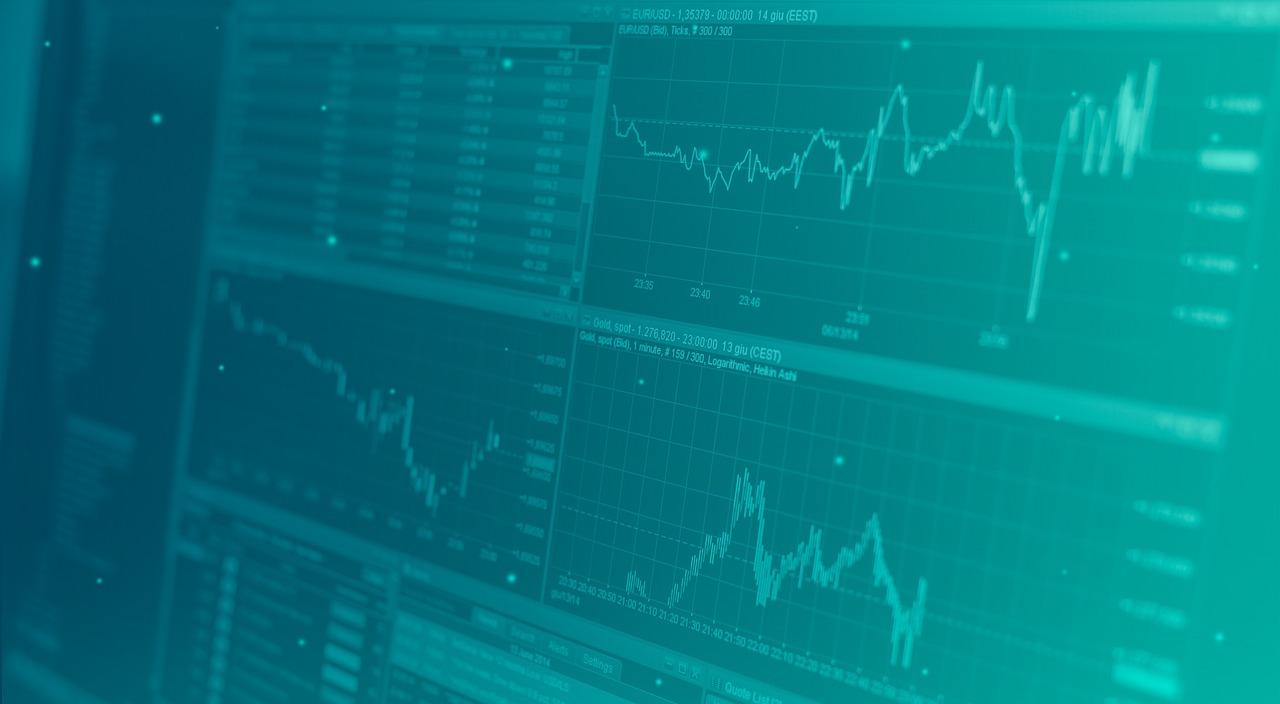
Image source: https://pixabay.com/ro/photos/business-chart-graph-graphic-5475664/
What are bullish and bearish trends?
In crypto and other market types, two trends provide an easy-to-understand view on performance: when prices rise and fall. While bull and bear markets are also used for stock markets, they expanded to crypto.
Hence, a bull market happens when crypto prices increase when the general economic stability is positive. It may be possible that these shifts are more significant compared to the stock market due to crypto’s high volatility.
On the other hand, a bear market occurs when the investor sentiment index has a sudden drop rate, meaning prices will constantly drop. What’s more interesting is that it takes a minor market change for the bear market to occur, but if the media fuels it, it’s more likely to be significant.
Why is it important to know if a bull or bear market will start?
While it’s impossible to accurately see the fine line of a bull or bear market beginning, as an investor, you only need to analyze the signs to adjust your portfolio. For example, during the bull market, users tend to sell high since the cryptocurrencies’ value is rising, and the increasing liquidity contributes to a positive trend. But when a bear market starts, investors buy assets at lower prices, hoping their value will rise.
How to read the charts to see the beginning of a bull or bear trend
Generally speaking, you can sense a bull market approaching if you read the news. When you see positive articles about cryptocurrency, the economy is on the rise, and public figures become interested in these coins, it might be that the digital market will also have a good time.
But you can make sure this is the case when reading a chart. As you may know, the best way to invest in crypto is by analyzing technical indicators, such as the following:
- Moving averages (MA) indicate turning points. There’s the Simple Moving Average (SMA) that shows an upcoming bull trend when it’s rising, but if it’s falling, it might be the base of a bear market beginning;
- The Relative Strength Index (RSI) shows how fast prices will change. Its value starts from 0 and ends at 100. Anything over 70 means the asset is overbought, but when the index is under 30, the coin is oversold;
- Bollinger bands indicate volatility levels. It is depicted as simple lines, and when they’re wide, volatility is high (bear trend), while narrow bands mean low volatility (bullish markets);
- The Stochastic Oscillator helps compare an asset’s price from the closing moment to a specific period. It indicates similar signs as the RSI;
- The Crypto Fear and Greed Index is essential to check because it shows investors’ emotions about the market. If users express fear, they don’t want to lose, so they sell assets, but if greed rules the market, investors want to make the most out of crypto, so they buy a lot of coins;
Candlesticks: common visual representations of prices
Another element you must get used to includes candlesticks. These patterns showcase price activities in specific time units. The shape of the candlestick shows the closing and opening of an asset on the thicker part, while the wick represents high and low-price points.
The color of the candlestick is also vital to notice. Green candles indicate a price rise or a bullish tendency, while red candles hint at decreased costs or bearish trends. There are many types of candlestick models, such as the following:
- The shooting star is usually a sign of a bear market but offers investors clues about the resistance against price increases, which is why they anticipate selling assets;
- The inverted hammer candlestick follows a bullish trend, especially if it is seen after a price drop because experts consider this to be a sign of high buying demand;
Social media as a reliable source of information
Although this tip might seem controversial, you may consider turning to social media when looking for market opinions. That’s because platforms like Reddit are the perfect communication channels for any user. Still, the platform is also loved by many crypto enthusiasts due to the massive community there.
So, to check the market pulse, you can turn to these communities and check the general opinion about a certain asset to adjust your portfolio accordingly. Still, you must be aware of disinformation risks, so check the subreddits you read and confirm they don’t spread fake information. For example, recently, some users from X that used to be Twitter reported the platform to be spanned with phony data, so you may want to avoid using it.
Final considerations
Reading crypto charts can be difficult, especially since it involves a lot of elements and features that all signify specific things. At the same time, charts need to be interpreted, which can leave the final decision to the investor’s personal experience with crypto. Therefore, forecasting a bullish or bearish market poses particular difficulties. Still, it is one of the best ways to invest or trade in crypto because it thoroughly analyzes the market prices and trends.